
Getting to know the TikTok Research API
By Laura Edelson
May 6, 2024
Early this year, I got access to the TikTok Research API. Other folks at Cybersecurity for Democracy have been using this API for a little while, so I had a leg up in understanding how to use it. I wanted to pay that forward, and also share some interesting early results that may highlight both what is possible with the API and what the gaps might be.
TikTok’s Research API has a lot to recommend it, although more development is certainly needed. To start with the good: data returned about posts contains both view counts and engagement counts. This is a serious limitation of CrowdTangle, for example, and platforms have historically been stingy about sharing view counts with researchers. View counts are critical for understanding how users experience platforms, which can’t be directly inferred from the prevalence of content alone. And the good doesn’t end there: Videos have a text transcription available in a field called ‘voice_to_text’, although for our data only one-fifth of them had this field populated. This can be a serious cost savings for researchers who might otherwise need to download their videos and use an (expensive) transcription API or develop their own model. There is also a well-developed codebook that lays out what data are available, and the API supports queries with complex filtering combinations. Regarding the bad, there currently is no official Python wrapper for the API (although C4D built one for this and other research, and we’ll be open-sourcing that in a couple of weeks). Also, the rate limit is fixed at 1,000 requests per day, with a request returning a maximum of 100 videos. In all fairness, this is likely fine for folks who want to study communication inside communities, but for researchers like my team who want to study the algorithm itself, this level feels a little restrictive. Finally, the view and engagement counts reported through the API are often significantly lower than what is reported through the app. TikTok says this is because of an archiving delay, and that accurate data can take up to 10 days to populate, but this doesn’t really explain what I saw. I was requesting data that was months old, and the counts still were way off in some cases. In this work, I use solely numbers retrieved from the TikTok API.
A Few Words About TikTok
For folks who are unfamiliar with TikTok, the platform doesn’t rely on social networks, unlike Instagram or X. Users are immediately shown a ‘For You’ page, which shows them one piece of content at a time that will play in a loop until they swipe to the next. Users can follow other users, but doing that doesn’t impact their ‘For You’ page. According to leaked documents, TikTok’s feed algorithm is designed to maximize ‘Time Spent’, and it does that primarily by identifying what kind of content you like to see, rather than which creators you want to see content from.
Data Collection
I wanted to study the spread of content about the war in Israel and Gaza, so I started with a list of 50 hashtags about the conflict. Six were typically associated with ‘General’ content, 22 were associated with ‘Pro-Palestine’ content, and 22 were ‘Pro-Israel’. Because of the low rate limit, I focused data collection on 11 specific, 3-day time windows around key events, plus one ‘quiet’ period when (relatively) less was going on. The first time period was Oct. 7-9, 2023, and the last was Jan. 26-29, 2024. I requested data in March and April of 2024 through the TikTok API for my specified hashtags and specified time periods for the US.
To validate the hashtags, I first reviewed 11 randomly selected posts for each hashtag to ensure they were relevant to the events in Israel & Gaza and that the General/Pro-Israel/Pro-Palestine stance labels were correct. After this review, 2 Pro-Israel, 1 Pro-Palestine, and 2 General were removed for lack of relevance, but the stances were all determined to be generally correct (though not perfect). Of course, each post has multiple hashtags. To deal with this, each post was coded as ‘Pro-Israel’ if it contained only Pro-Israel or General coded hashtags, ‘Pro-Palestine’ if it contained only Pro-Palestine or General hashtags, ‘Mixed’ if it contained both Pro-Israel and Pro-Palestine hashtags, and ‘General’ if it contained only ‘General’ hashtags. There were only a small number of ‘Mixed’ posts, and for reasons of coherence, these posts were also removed. This left us with 282,433 total posts.
Another C4D researcher and I labeled another random sample of 150 Pro-Israel, Pro-Palestine, and General posts (50 each). We had a relatively high agreement (agreed on 146 of 150 tags) and found that the Pro-Israel and Pro-Palestine tags were very accurate, 94% and 92% respectively. The General tags were less so - they were only ~66% accurate. The biggest source of error in the General stance category was from 'trend chasing.’ Once a hashtag is trending, other users will attach it to unrelated posts in a bid to boost attention on their content. This didn’t seem to impact the highly viewed General content much, so this strategy doesn’t appear to work all that well on TikTok. It also means that this type of error is concentrated in low-view posts. Otherwise, the errors among posts that were relevant to the conflict but weren’t ‘General’ reflected the background posting activity, which meant more were Pro-Palestine than Pro-Israel. This type of error did occasionally happen among highly viewed posts. Phew, boring preliminaries out of the way, on to the results.
Post Stances
‘General’ Posts
Overall, there were 101,706 ‘General’ posts which received a total of ~492M views, for an average of 4,833 views per post. Most of the General content I reviewed (both the highly viewed content as well as the random samples) was news content about ongoing events in Gaza. Sometimes this is content posted by news outlets themselves, but sometimes it is individual accounts reposting a screengrab or even a camera recording of a screen playing the original content. Anecdotally, it was surprising to me how few mainstream news sources appeared to be active on TikTok. Which is not to say they are totally absent: content from a couple major outlets including the Daily Mail did show up among the highly-watched content, and I observed several widely-seen posts that were clearly sourced from mainstream news sources and ‘TikTokified’ by what appeared to be non-affiliated authors, so this doesn’t appear to be because of lack of demand.
‘Pro-Israel’ Posts
There were 8,843 ‘Pro-Israel’ posts during these time periods, which received an average of 1,584 each and a total of 14M views. Some of this content was from individuals posting their own commentary about the conflict, some was cell phone-captured videos of relevant events paired with text commentary, and there were also some meme style videos with messages of support.
‘Pro-Palestine’ Posts
‘Pro-Palestine’ content was the most numerous in the dataset with 170,430 posts. Those posts received ~236M views, for an average of 1,386 views per post. In terms of content style, the Pro-Palestine content I reviewed was mostly similar to the Pro-Israel posts, in that they were typically personal reflections, videos of events overlaid with commentary, and memes.
Posting Activity
When we look at posting activity by stance, there appear to be two distinct patterns over time. General and Pro-Israel content peak early and then slowly decay over time. This is a familiar pattern that we’ve seen before after other major events, such as Russia’s invasion of Ukraine. However Pro-Palestine posting activity is on an entirely different trajectory. Instead of peaking early, there is a big jump in the second week followed by a steady increase over time, peaking in the Nov. 15th window before declining symmetrically for the remainder of 2023.

View Activity/Views Per Post
Of course, the most burning question about TikTok hasn’t been about what people are posting - it’s been about what content is being amplified by the feed algorithm. To better understand differences in the rates at which content is shown to users by the recommendation algorithm (aka, amplification), I looked at the average number of views the posts in each stance category were receiving. The graph below shows the average number of views posts in each stance category received during each time window. When we look at things this way, there appear to be a few distinct phases, which I’ll talk about in turn.

Phase 1
Early on, for the three and a half weeks, we see amplification that primarily boosts ‘General’ content. The overall views per post is highest in the first week and falls off markedly after that, but the proportionality remains similar. This is interesting because it is quite different from the typical narrative about social media boosting the most extreme voices. Of course, TikTok has a reputation for being less polarizing than other platforms, and that is certainly reflected here. I should note that this isn’t just amplification of the dominant narrative, which is what we have seen on TikTok on other issues. If that were the case, then after the second week, I would have expected to see amplification of Pro-Palestine content overtake General, but that’s not what happens. General continues to receive the most algorithmic lift, even though it is no longer the largest posting category.
Phase 2
In the October 27th window, Pro-Israel content begins to have much higher views per post than it had previously: 2,555 views per post compared to 336 in the Oct. 17th window. It’s not immediately clear to me why this is the case. The top content isn’t (to my eye) all that different from prior week’s content. Later though, from the cease-fire period starting Nov. 24th on, it’s clear that content about the return of hostages is the bulk of the highly-viewed Pro-Israel content.
Phase 3
From Dec. 15th on, views per post for all categories fell markedly. The Pro-Israel content, for example, fell from 3,442 average views per post during the Nov. 30th period to 412 during the Dec. 15th period. Some of this is to be expected as the natural decline of interest in a topic as it ages, but the speed of the fall-off is striking. It’s also notable to me that the steep drop off in views precedes the drop off in posting. It’s possible these effects are related, but we would need more robust and diverse observations in order to know that.
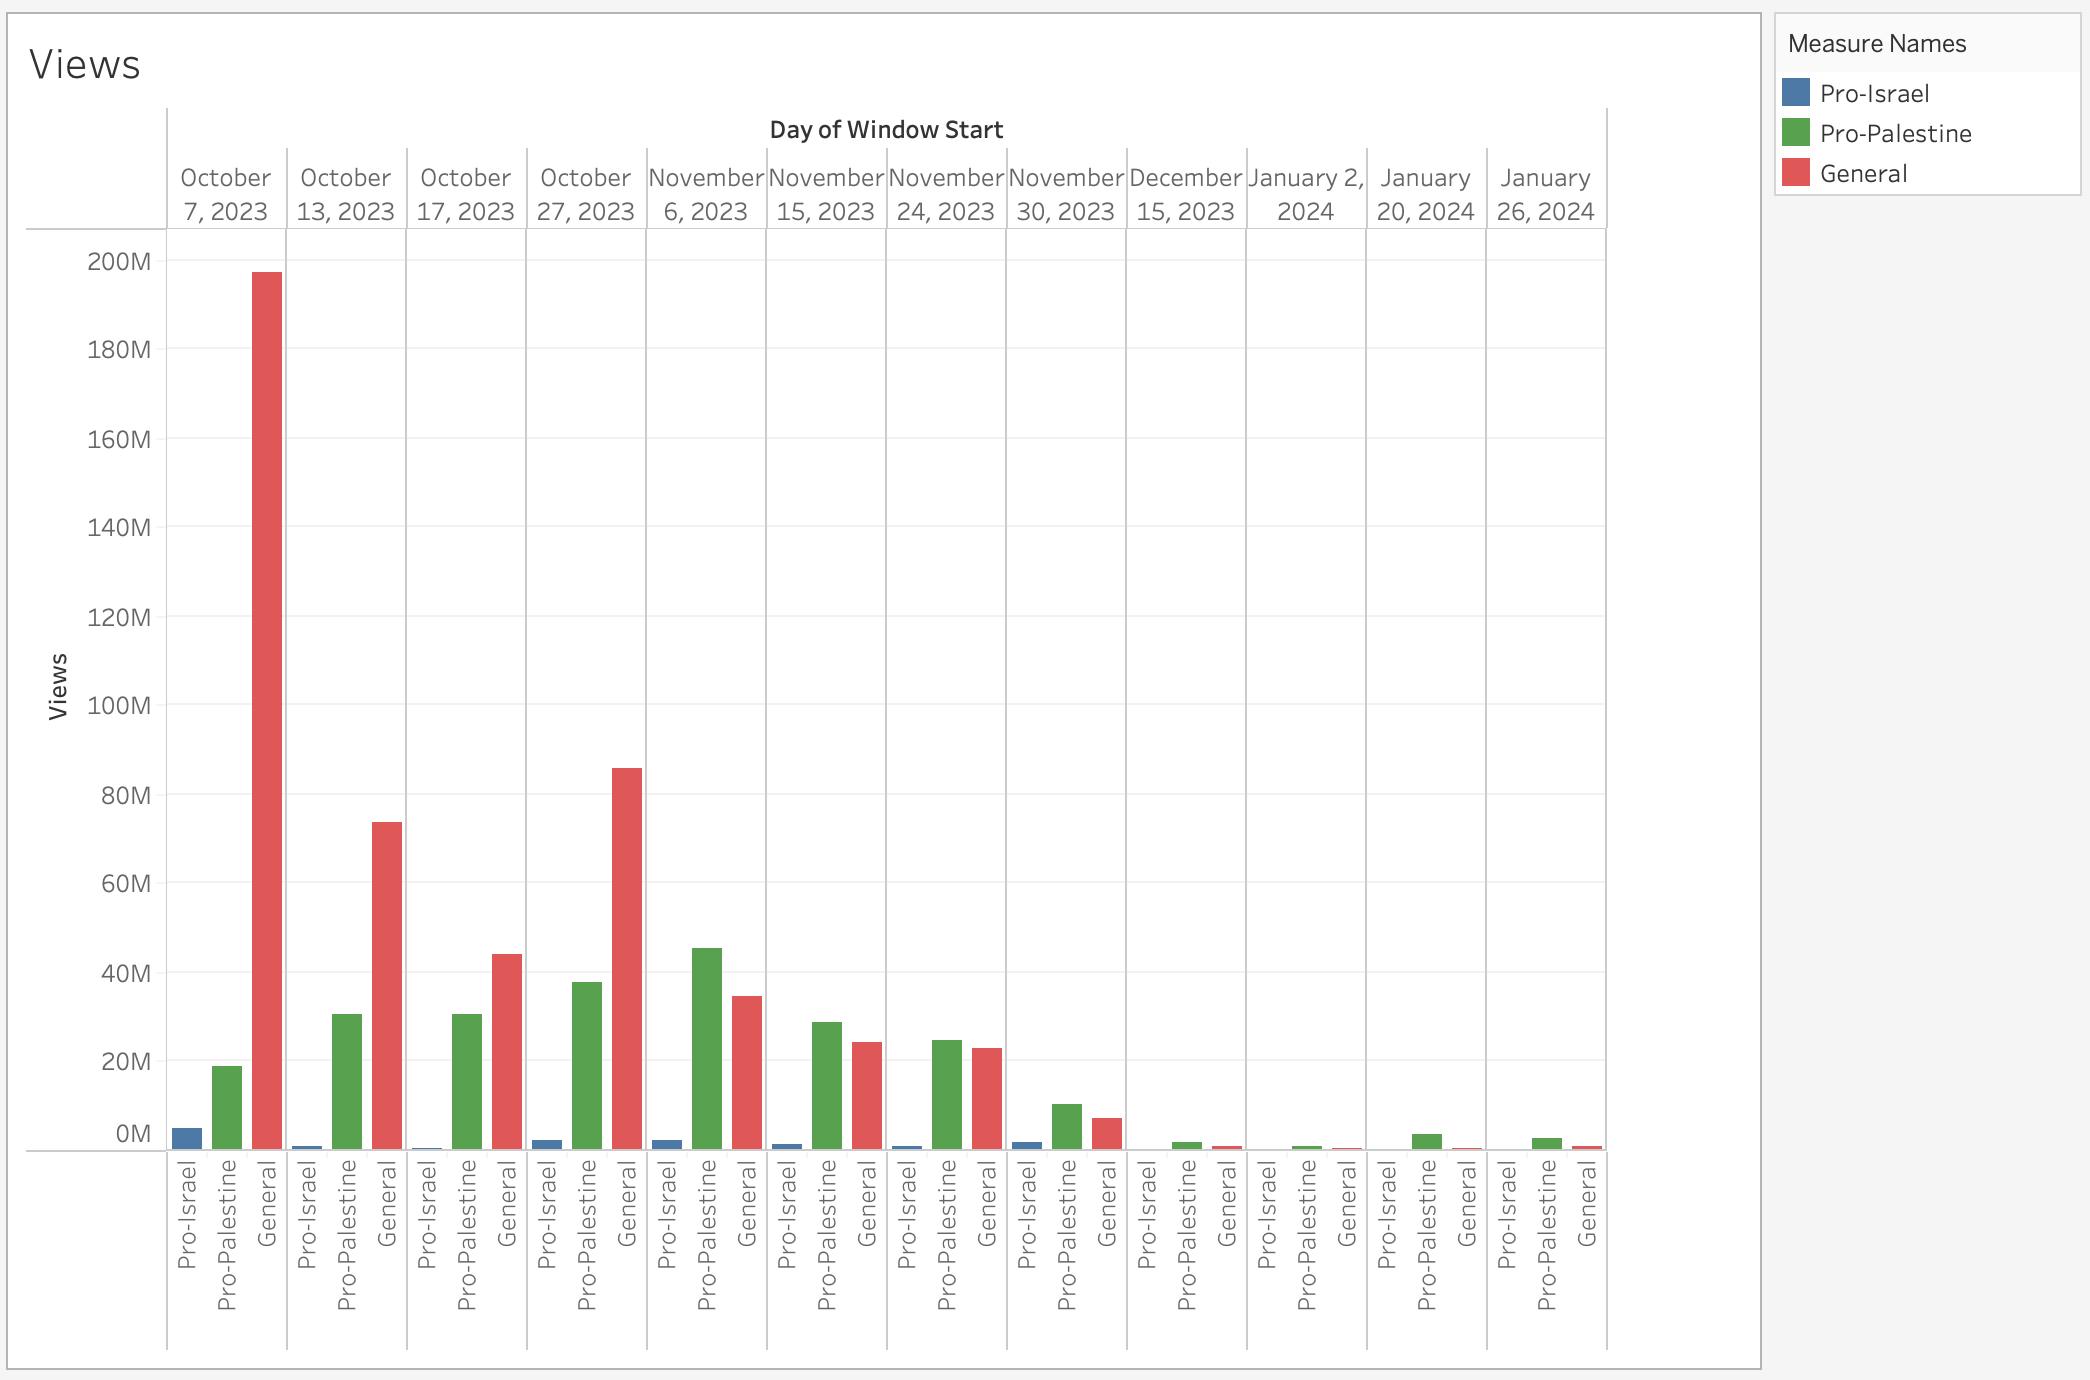
Total Views
Combining posting activity and views per posts yields us with this perspective of total views. Different rates of amplification mean that the already big differences in posting activity are magnified. So this is what happened. We can easily see how we get to TikTok, as an environment, having much more Pro-Palestinian content than Pro-Israel content. We can also see that for much of October 2023, General content was by far the most dominant. But these data alone cannot tell us why there were such meaningful differences in views per post. There is at least one thing we can rule out, however. This effect doesn’t appear to be tied to user engagement.
Engagements per 100 Views
The TikTok API also gives us visibility into counts of ‘likes’, comments, and shares - the primary forms of engagements on the platforms. We and others have found on other platforms, more polarized content is more engaging content. So it is not surprising to see that Pro-Israel and Pro-Palestine content is, through most of the period, more engaging per view than General content.

As discussed earlier, it is widely understood that TikTok maximizes for watch time rather than engagement, and it’s also widely believed that session duration and engagement exist in tension. If that’s true, it certainly lines up with what we see here. Personally, this was one of the perspectives I was most excited to get, because generally speaking, social media APIs rarely offer the data that allow us to look at both engagement and views together.
What does this tell us about TikTok?
The most important thing to note is that I can’t say why any of the patterns I observed happened - I can only say that they happened. Given that, it’s fair to ask - why am I publishing this at all? One thing that is clear from the data I've analyzed is that shifts in amplification change people’s experience of public debates on social media in way that are separate from what content people are posting. People are aware of this: to a certain extent, that is the point of the current generation of social media. In theory, feed algorithms are supposed to distort perceptions of content by identifying the ‘best’ content and magnifying that, and by extension not magnifying everything else. People often talk about not understanding why feed algorithms do what they do, but the issue goes beyond that. We hardly understand what ‘the algorithm’ is doing either.
This is an area where feed algorithms suffer from a structural lack of transparency. It isn't hard to figure out the political stance of the New York Times, or the Wall Street Journal. But social media feed algorithms, whether their makers intend them to or not, also have political stances - they are just much harder to observe. The data transparency TikTok is currently offering to academics is a good start, and I'd encourage other companies to follow their example. Meta recently announced that it will be shuttering CrowdTangle, and that will be a real step backward for transparency. But TikTok, and all other social media companies should go further and offer algorithmic transparency around both feed recommendation and moderation to their users so we can all better understand what companies' feed algorithms are actually doing. There actually is legislation that has been proposed in the United States that would require major platforms to be significantly more transparent with the public: the Platform Accountability and Transparency Act.
I think the question of what social media algorithms should do is that we need to explore as a society together. In fact, we already are: our elected representatives debate it in Congress, academics debate in universities, and everyone debates it on X and TikTok and Threads. But I think it is very hard to explore that question productively when we don’t really understand what feed algorithms are doing now or why they behave the way that they do. In the past, TikTok has said that they want to keep politics off the platform. They have walked back from this somewhat in recent years, because, I suspect, that isn’t a tractable stance. Sometimes, even the events in people’s lives are political, so if you are a platform for general content, having some content that will generally be judged to be political is probably unavoidable. Given that, I’d encourage readers to really think hard about exactly what they want platforms to do with this type of content. Do you want platforms to democratically reflect posting activity, something (theoretically) like a ‘letters to the editor’ section of a newspaper? Do you want them to pick a side and be transparent about it, like an editorials page? Whatever goal you might have, you probably don’t think the same approach should apply to political content that applies to dog videos, for example. Or maybe you do! Even dogs are political sometimes.
What Does This Tell Us About the Research API?
We don’t have any way of validating whether the hashtags we selected captured all of the content on TikTok in the US about the war in Gaza. However, there are some signs we had decent coverage. Some of the hashtags were popular enough that we observed ‘trend chasing’, where creators will add many trending hashtags to unrelated posts. We also know our initial hashtag selection was overbroad because we had to remove some after our collection. This doesn’t mean we captured all relevant hashtags, of course! The research API lets you query data by hashtag, description, and user, so to a certain extent, you need to know what you’re looking for. The research API returns data about public videos, video comments, and user accounts. It allows fine-grained searching by keyword and hashtag, but there is no equivalent of the Twitter firehose. We are thinking through methods to estimate ‘top content’, and prior work from other researchers has attempted this for other platforms. Because of the very strong imbalance of views to content, to understand what (most) people are seeing, the top 1% of content appears to be a pretty good approximation. However, it clearly wouldn’t help researchers who wanted to study posting activity, either by itself or in connection to view activity.
For our maybe-sufficiently exhaustive hashtags about a single (major) topic, we averaged about 8K posts in the US per day over a several month period. Posting activity was highly uneven though, so I would expect periods of time close to major events to have significantly more than time periods even a few weeks later. We don’t know how large other topics are, or if that is typical. We’re not aware of other work that has estimated the size of TikTok’s information ecosystem (although we haven’t done an exhaustive review - it may be out there). But as a ballpark estimate, it’s probably reasonable to think that with the rate limit as it is, you could keep up with several major topics on TikTok or retrieve a reasonable amount of recent history in a reasonable amount of time for a single major topic in the United States. It probably would not be possible to keep up with all news in the United States, as we have done on other platforms, but it might be possible in small news ecosystems.
Appendix
Hashtags
General
#israel, #israeli, #gaza, #hamas, #israelpalestine
Pro-Israel
#IDF, #Zionism, #westandwithisrael, #standwithisrael, #istandwithisrael, #prayforisrael, #israelhostagerelease, #jewishpride, #proudjew, #prayingforisrael, #israelunderattack, #saveisrael, #helpisrael, #christiansunitedwithisrael, #usisrael, #israelarmy, #idfsoldier, #jewishlivesmatter, #proisrael, #hamasisisis
Pro-Palestine
#freepalestine, #zionist,#airstrike, #westandwithpalestine, #palestinewillbefree, #palestineprotest, #PrayforPalestine, #StopGenocide, #SaveGaza, #gazaunderattack, #SavePalestine, #childrenofgaza, #istandwithpalestine, #parentsofgaza, #immediateceasefire, #israelzionist, #idfterro3ist, #ceasefire, #ceasefirenow, #warcrimes
Dates
